The Data Warrior

Changing the world, one data model at a time. How can I help you?

Archive for the category “Data Modeling”

East Coast Oracle Users Conference (#ECOracle13) Review

This week I did a little travel and went to Durham, North Carolina to present at the 2013 East Coast Oracle Users Conference (aka ECO). While I have been aware of this event for over 20 years, it is the first time I have attended.

It was worth the trip. (Thanks to Jeff Smith at Oracle for alerting me to the event and encouraging me to submit). He actually sent me, Danny and Sarah (The EPM Queen). It was great to have members of the ODTUG clan together.

The gang of three - ODTUGers at ECO13 thanks to That Jeff Smith guy. Yea - he sent us!

The gang of three – ODTUGers at ECO13 thanks to That Jeff Smith guy. Yea – he sent us!

Overall a well run event held at the Sheraton Imperial Hotel and Conference Center. It drew over 300 attendees and a large list of Oracle ACE and ACE Directors were there to present to a crowd very eager to learn and network.

Fun and Games: The Keynote

Our opening keynote from Steven Feuerstein (inventor of the PL/SQL Challenge)  was a fun take on different types of therapy and how they might be applied to software developers.
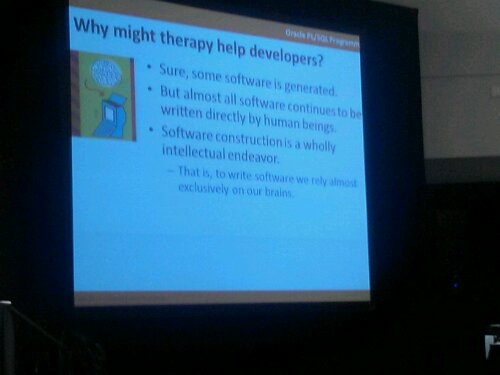
PL/SQL Evangelist Steven Feuerstein discusses Coding Therapy for Software Developers

PL/SQL Evangelist Steven Feuerstein discusses Coding Therapy for Software Developers

His discussed the use of:

  • Game therapy (try out mastermind or setgame.com)
  • Dream Therapy
  • Confessional Therapy
  • Shock Therapy
  • Couples Therapy
    • For DBA & Developers
    • For Developers & Their Managers

It was a fun, light way to start the conference with some very valuable advice.

Heavy Duty DBA-type Tuning Talks

Oracle ACE Director, author, and trainer Craig Shallahamer did two deep dive tuning sessions that I attended. In the first one, Introduction to Time-based Performance Analysis: Stop the Guessing, Craig gave us his four point framework for Holistic Performance Analysis. The points were:

  1. The Three Circles to consider (OS, Database, Application)
  2. Be Quantitative (i.e., trust the numbers not a hunch)
  3. Serialization is death, Parallel is life
  4. Tell a story (make the explanation of the issue understandable to managers)

With that he got into all sorts of v$ view stuff that went mostly over my head. Needless to say I will have to download the slides from his site (orapub.com) and give them to someone more attuned to this kind of tuning than I!

Oracle ACE Director, Craig Shallahamer discusses low level details for understanding Oracle CPU consumption

Oracle ACE Director, Craig Shallahamer discusses low level details for understanding Oracle CPU consumption

The second presentation Craig gave was called Understanding Oracle CPU Consumption: The Missing Link. Again lots of views and some Linux OS utilities (e.g., perf) and lots of numbers were displayed and discussed to try to ferret out how to determine what Oracle functions were actually taking up CPU time.

Even though I don’t really understand a lot of this (hey, I am a data modeler, not a dba right?) I like to go to sessions like this as I enjoy listening to smart people talk passionately about the things they do, and I figure I might retain just enough to point someone else in the right direction in the future, even if it is only to give them a copy of these slides!

Lovely Southern Style Lunch

ECO had one of the nicest little lunch buffets I have eaten in a while. Very simple southern food that included cole slaw, potato salad, baked chicken, fried chicken, pulled port (with N. Carolina bbq sauce), hush puppies and apple cobbler. (I did not say it was a light lunch right?)

I love all kinds of BBQ and the pulled pork did not disappoint. I do not usually like fried chicken but figured I should try it and was pleasantly surprised. Crisp and moist. Very nice.

Traditional Southern Fare for Lunch

Traditional Southern Fare for Lunch

My 1st Session – Making Data Modeling Fun

I had the best turnout ever for this topic with over 40 people in the session most of whom were game to try my gamification of data model review sessions.

Session attendees developing Haiku poems based on a Data Model

Session attendees developing Haiku poems based on a Data Model

One of the tasks was to translate relationship sentences and model descriptions into Haiku (or another form). There were prizes as an incentive to play along.

Some of the prizes for participants at my talk

Some of the prizes for participants at my talk

The winner by general acclamation was Edie Waite from Raleigh, NC with this little limerick:

There once was a country named France
Which had many regions for dance
The locations they chose to dance on their toes
Made employees all look askance.

The data model we used had the entities: Country, Region, Employee, Locations, and a few others.

Another Haiku from Sarah Zumbrum (a noted non-data modeler) went like this:

More than one region
Can reside in a country
Like the USA
The session was really a lot of fun thanks to everyone being open minded and being willing to try some unconventional approaches to gathering data model requirements. (There was one other Haiku in French which I will add as soon as the author sends it to me!)

ECO 13 – Day 2

Keynote today was about eBusiness suite stuff. I sat there after breakfast mostly not listening as I started to put this blog post together.

Then I did my 2nd talk.

Agile Data Warehouse Modeling

I had a somewhat disappointing turnout (only 5 people, sigh) but it was a great exchange with those 5 people. We had a very good discussion about applying agile techniques to building a data warehouse and I was able to introduce them to some of the details of Data Vault Data Modeling. None of them knew much about data vault, but some had heard the term.

One attendee did tell me he was skeptical about the approach when he came in as he was a traditional Kimball dimensional data warehouse guy. But after the session he was willing to concede there was some merit and ideas he had not seen before and he was going to take those into consideration as he embarked on a new phase of his project where there were some complex problems to solve. He could see that data vault might just help.

Really can’t ask for more than that!

Embedded Analytics

So my last session for the event was to attend Craig Warman’s talk on embedded analytics. It was a good discussion about how BI and analytics have evolved, Craig presented a simple maturity model as part of the talk:

Level 0: BI reporting and analytic applications are completely seperate from other applications
Level 1: Gateway Analytics – Operational applications have a report tab or menu item to launch the BI reporting tool interface. Maybe there is a login pass through.
Level 2: Inline Analytics – at this level, the analytics and BI tool has been incorporated into the operational application interface to the point it has the same look and feel and you can’t tell it is a separate product or tool. This where many organizations are today.
Level 3: Infused Analytics – this is the goal. At this level the analytics are truly part of the application and provide core functionality. Examples of this are the recommendations you get on Amazon as you check out or the movie suggestions you get on Netflix based on your prior movie choices. If the analytic pieces were removed the application would not function correctly.
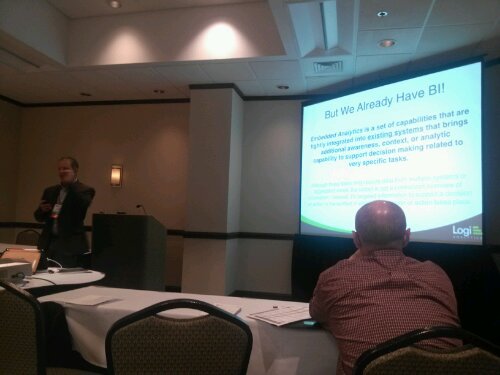
Craig Warman (ECO13 conference chair) talks about what embedded analytics is (and is not)

Craig Warman (ECO13 conference chair) talks about what embedded analytics is (and is not)

Well that’s it for this conference.

Put ECO on your radar for 2014.

See you around.

Kent

P.S. Next conference on my agenda is RMOUG TD 2014. Let me know if you will be there.

Agile Data Warehouse Modeling: How to Build a Virtual Type 2 Slowly Changing Dimension

One of the ongoing complaints about many data warehouse projects is that they take too long to delivery. This is one of the main reasons that many of us have tried to adopt methods and techniques (like SCRUM) from the agile software world to improve our ability to deliver data warehouse components more quickly.

So, what activity takes the bulk of development time in a data warehouse project?

Writing (and testing) the ETL code to move and transform the data can take up to 80% of the project resources and time.

So if we can eliminate, or at least curtail, some of the ETL work, we can deliver useful data to the end user faster.

One way to do that would be to virtualize the data marts.

For several years Dan Linstedt and I have discussed the idea of building virtual data marts on top of a Data Vault modeled EDW.

In the last few years I have floated the idea among the Oracle community. Fellow Oracle ACE Stewart Bryson and I even created a presentation this year (for #RMOUG and #KScope13) on how to do this using the Business Model (meta-layer) in OBIEE (It worked great!).

While doing this with a BI tool is one approach, I like to be able to prototype the solution first using Oracle views (that I build in SQL Developer Data Modeler of course).

The approach to modeling a Type 1 SCD this way is very straight forward.

How to do this easily for a Type 2 SCD has evaded me for years, until now.

Building a Virtual Type 2 SCD (VSCD2)

So how to create a virtual type 2 dimension (that is “Kimball compliant” ) on a Data Vault when you have multiple Satellites on one Hub?

(NOTE: the next part assumes you understand Data Vault Data Modeling. if you don’t, start by reading my free white paper, but better still go buy the Data Vault book on LearnDataVault.com)

Here is how:

Build an insert only PIT (Point-in-Time) table that keeps history. This is sometimes referred to as a historicized PIT tables.  (see the Super Charge book for an explanation of the types of PIT tables)

Add a surrogate Primary Key (PK) to the table. The PK of the PIT table will then serve as the PK for the virtual dimension. This meets the standard for classical star schema design to have a surrogate key on Type 2 SCDs.

To build the VSCD2 you now simply create a view that uses the PIT table to join the Hub and all the Satellites together. Here is an example:

Create view Dim2_Customer (Customer_key, Customer_Number, Customer_Name, Customer_Address, Load_DTS)
as
Select sat_pit.pit_seq, hub.customer_num, sat_1.name, sat_2.address, sat_pit.load_dts
from HUB_CUST hub,        
          SAT_CUST_PIT sat_pit,        
          SAT_CUST_NAME sat_1,        
          SAT_CUST_ADDR sat_2
where  hub.CSID = sat_pit.CSID           
    and hub.CSID = sat_1.CSID           
    and hub.CSID = sat_2.CSID           
    and sat_pit.NAME_LOAD_DTS = sat_1.LOAD_DTS           
    and sat_pit.ADDRESS_LOAD_DTS = sat_2.LOAD_DTS 
 

Benefits of a VSCD2

  1. We can now rapidly demonstrate the contents of a type 2 dim prior to ETL programming
  2. With using PIT tables we don’t need the Load End DTS on the Sats so the Sats become insert only as well (simpler loads, no update pass required)
  3. Another by product is the Sat is now also Hadoop compliant (again insert only)
  4. Since the nullable Load End DTS is not needed, you can now more easily partition the Sat table by Hub Id and Load DTS.

Objections

The main objection to this approach is that the virtual dimension will perform very poorly. While this may be true for very high volumes, or on poorly tuned or resourced databases, I maintain that with today’s evolving hardware appliances  (e.g., Exadata, Exalogic) and the advent of in memory databases, these concerns will soon be a thing of the past.

UPDATE 26-May-2018  – Now 5 years later I have successfully done the above on Oracle. But now we also have Snowflake elastic cloud data warehouse where all the prior constraints are indeed eliminated. With Snowflake you can now easily chose to instantly add compute power if the view is too slow or do the work and processing to materialize the view. (end update)

Worst case, after you have validated the data with your users, you can always turn it into a materialized view or a physical table if you must.

So what do you think? Have you ever tried something like this? Let me know in the comments.

Get virtual, get agile!

Kent

The Data Warrior

P.S. I am giving a talk on Agile Data Warehouse Modeling at the East Coast Oracle Conference this week. If you are there, look me up and we can discuss this post in person!

Better Data Modeling: New and Improved Oracle SQL Developer Data Modeler (#SQLDevModeler)

Yup, my friends at Oracle have been hard at working enhancing what was already the best FREE data modeling tool out there.

They just released SDDM R4 EA3! You can go get it right now: http://www.oracle.com/technetwork/developer-tools/datamodeler/downloads/datamodeler-4ea-downloads-1988443.html

As always there are both new features and bug fixes.

One of the coolest new features is the ability to show entity (or table) comments right on the diagram in the object. This will be very useful for enabling data model reviews with the business users.

Product manager Ashley tweeted and example the other day:


For even more details and ideas how to use this feature check out Jeff Smith’s post on the feature here.

So what are you waiting for? Go get it today!

Data Modeling is Fun!

Later

Kent
The Oracle Data Warrior

Better Data Modeling: Finding Missing Unique Keys in Oracle #SQLDevModeler

One of the best practices I recommend is to always define unique business keys for every entity (or table) in a model.

It is the only way to really understand what the data in that object represents.

So what do you do when you inherit someone else’s model with hundreds of tables and few (if any) unique keys to be found?

After you reverse engineer it into SDDM (SQL Developer Data Modeler), you could go through the model table by table and look at the properties.

Or, you could look at all the diagrams to look for the the little U’s indicating a column is part of a unique key constraint (assuming there are any diagrams to look at).

Or you could create a Custom Design Rule that checks for you.

So how do you write a design rule that will list all tables with no UKs on them?

Open your design, the go to Tools -> Design Rules -> Custom Rules.

  1. Hit the green Plus sign to add a new rule.
  2. Give it a name (like Missing UKs),
  3. Select Table for the object type,
  4. Mozilla Rhino for the Engine,
  5. Warning for the type, and
  6. Select table as the variable
  7. Past in this code: 
function checkUKs(table){
ruleMessage=””;
if(table.getUKeys().size() == 0){
  ruleMessage=”no UKs”;
  errType=”Problem:”;
  return false;
} else {
  return true;
}
}
checkUKs(table);

Hit Save, then Apply.

The result will be a list of all the tables in your design that do not have any Unique Key Constraints defined.

Now the real work begins – fixing those tables! As you work your way through the model adding the new business keys, you can keep using this report to see which ones you have left, and make sure you don’t miss any.

Get to it my friends!

Kent

The Oracle Data Warrior

P.S. Special thanks to DimitarSlavov  of Oracle for posting the code to answer my question. If you want to see the whole thread go here.

Data Modeling for Fun and Profit: Are you ready to take the Database Design Challenge?

Are you up to publicly testing your database design chops?

Want to improve your street cred?

If so, then read on…

Relational databases form the backbone of thousands, if not millions, of applications and systems around the globe. A key part of building these applications is designing and implementing the data structures they use.

(Well a few of us “old school” guys still think so no matter what the anyone else thinks!)

Proper table design can mean the difference between a scalable, high performing database that is a joy to query and an unfathomable, unsupportable mess that makes your brain melt.

Given the importance of these databases, understanding good data modelling techniques and physical implementation methods are essential skills for data and system architects, database administrators and developers creating database applications.

Building on the hugely successful SQL and PL/SQL quizzes already available at the PL/SQL Challenge, the new weekly Database Design Quiz kicks off on Saturday, October 5, 2013 to help you build these skills. The quiz will cover many areas of database modeling and design, from logical design all the way to physical database design, including topics such as:

  • Normalization – ensuring you have high quality data
  • Referential integrity – saving you the time and effort of writing your own application-based constraints
  • Indexing – enabling you to write fast and efficient queries

Whether you’re an experienced data modeler or completely new to relational databases, the weekly Database Design Quiz offers you the opportunity to both learn new approaches and show off your expertise. It will teach techniques that you can use to improve the quality for your work and impress future employers with your achievements.

This weekly quiz is managed by Chris Saxon, who has been playing the PL/SQL Challenge since August 2010 and placed second in the most recent PL/SQL Championship. More to the point of this quiz, however, he is also a database technologist with 10 years experience designing and building Oracle database applications. He currently works as the Data Architect for the airline Flybe, a role which sees him creating the data structures for the flybe.com database and the company’s enterprise data warehouse. He also runs the blog www.sqlfail.com, a project to explain database concepts and other topics of interest using just SQL and PL/SQL.

Registering is quick, easy and free. If you’re not already a member of the PL/SQL Challenge, then head to www.plsqlchallenge.com and sign up for a free account.

Let the Database Design competition commence!

Show me what ya got!

Kent

P.S. I have been helping Chris a little by reviewing the questions and I can tell you this quiz will be a real challenge even for those of you with years of experience. So get on over and sign up today (there will be prizes): www.plsqlchallenge.com

Post Navigation